Cases
What is the Cases tab?
The Cases tab aims to give you detailed information about how your cases are being handled in your organization for a given period of time.
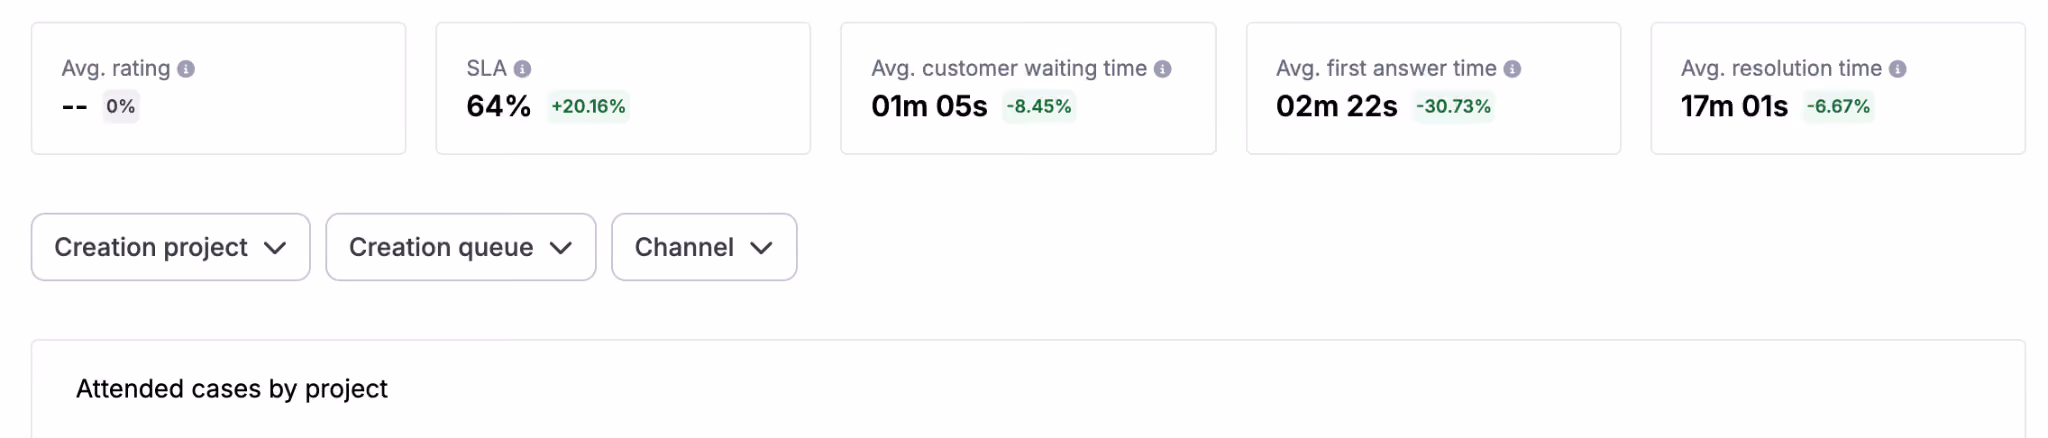
You will find a quick overview of what is happening with KPI’s on top and graphs below for further analysis, with information broken down by project, queue or channel.
Key Concepts
Created Cases: Total number of cases created within the selected date range.
Attended Cases: Total number of cases that have received at least one message from an agent and were created within the selected date range.
Resolved Cases: Total number of resolved cases created within the selected date range.
Discarded Cases: Total number of discarded cases created within the selected date range.
Average Cases per agent: Total number of attended cases divided by the total number of agents who attended those cases.
Average Rating: Average customer rating given by end-users to cases created during the selected date range.
SLA: Percentage of cases that met the SLA threshold over the cases created during the selected date range, excluding periods when queues are closed.
Average customer waiting time: Average time customers spent waiting for an agent response for cases created within the selected date range, regardless of whether queues were open or closed.
Average first response time: The average time it takes for an agent to provide the initial response after a case is created.
Average resolution time: The average time required to fully resolve a case from the moment it is created.
How to use it?
To use it, first log into your account:
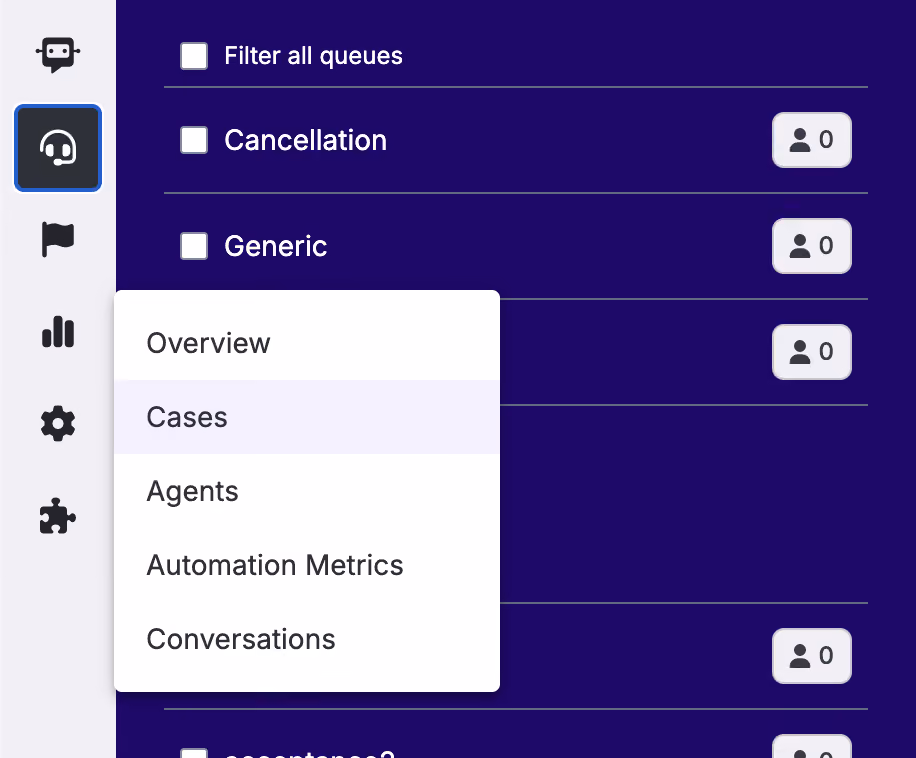
Navigate into the left-side bar and click the Cases section.
Select the date range on which you would like to filter all data.

Select the date range to compare the KPI’s with, so you can see the % of variation between the two periods.

Select the projects, queues or channels you want to view information from.
Examples or Use Cases
A manager wants to overview the different cases created, attended, resolved and discarded over a period of time together with some useful information like the average times the agents took to answer or resolve a case. They would also like to check this information per project and queue in the convenient table provided at the bottom.
An admin wants to follow the average customer rating over time to see if customers are happier with their support, being able to check the SLA as well together with most common contact reasons.
Best Practices
If you are a large organization, there might be issues when retrieving data from long periods of time. If it was the case and you get banners indicating that no data is available, try selecting shorter periods.