Realtime Dashboard
What is it?
The Realtime Dashboard is a live monitoring tool designed for managers and admins to oversee their teams' performance and operational status in real time. It provides instant visibility into agent activity, queue performance, and key service metrics across all assigned projects.
- Purpose: The Realtime Dashboard serves as the command center for workforce management and operational monitoring. It enables managers to:
- Monitor agent availability and productivity in real time.
- Track queue performance and identify bottlenecks.
- Ensure SLA compliance across all customer service channels.
- Make informed decisions about resource allocation.
- Identify and respond to emerging issues before they impact service quality.
- Value:
- Proactive Management: Spot issues as they happen rather than discovering them in retrospective reports.
- Resource Optimization: Quickly identify when queues need additional support or when agents can be redistributed.
- Performance Visibility: Understand both individual agent performance and overall team effectiveness at a glance.
- SLA Monitoring: Track service level compliance in real time to prevent breaches.
- Data-Driven Decisions: Access live metrics that inform immediate tactical adjustments.
- Scope: Realtime Dashboard is one of core sections within Helpdesk (alongside Inbox and Case Archive). It displays only current-state data—not historical trends. For historical analysis, use Case Archive. Dashboard updates automatically to reflect current conditions.
How to use it?
The Realtime Dashboard is divided into two main tabs:
1. Agents Tab
Provides a real-time agent monitoring their current operational status in the current day.
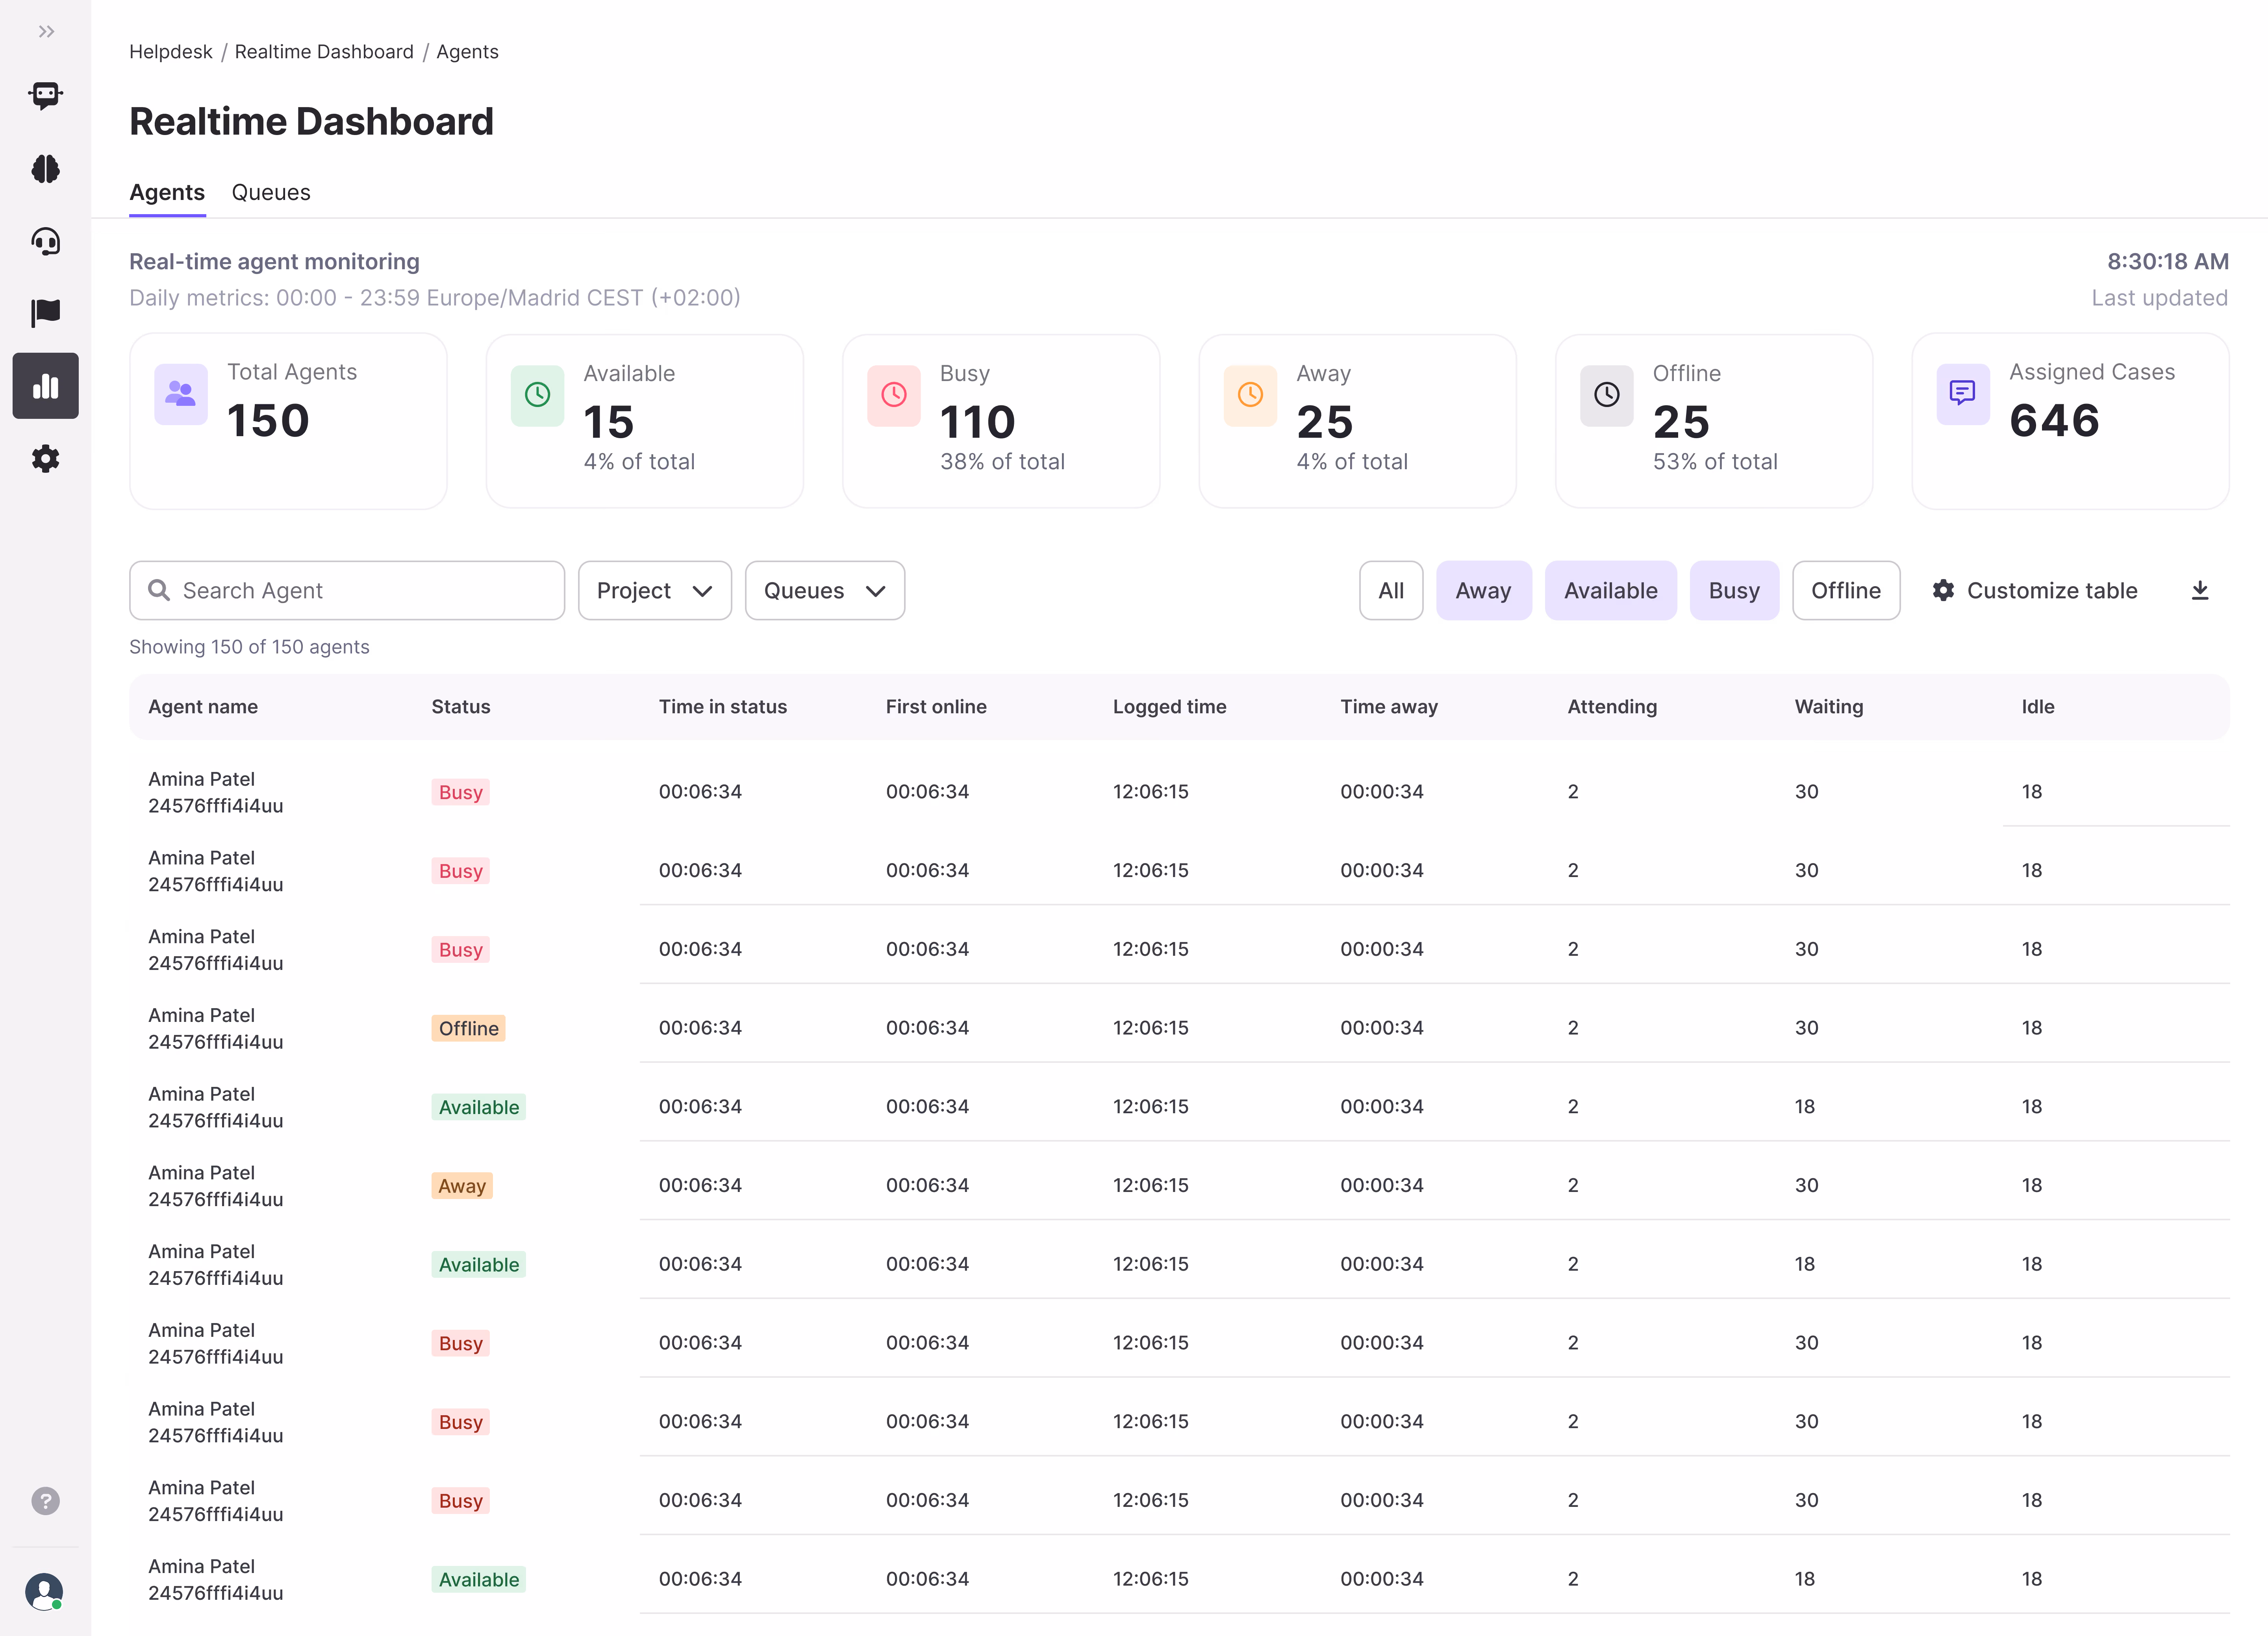
Monitoring Period:
- Dashboard displays data for the current day by default (resets at midnight)
- Time period shown at top: "Daily metrics: 00:00 - 23:59 Europe/Madrid CET (+01:00)"
- All metrics reflect current day's activity
Overview Metrics:
- Total Agents: Number of agents in the team
- Status Distribution: Real-time breakdown showing how many agents are Available, Busy, Away, or Offline
- Assigned Cases: Total number of cases currently assigned across all agents
Agent-Level Detail Table:
Each agent row displays:
- Status: Current availability (Available, Busy, Away, Offline)
- Time in Status: Duration agent has been in current status (Available, Busy, Away, Offline)
- First Online: Timestamp when agent first logged in for the current day
- Logged Time: Total time agent has been logged in the current day
- Time Away: Cumulative time spent in Away status
- Cases Assigned: Total cases currently assigned to the agent across all statuses
- Cases Attended: Total cases agent has engaged with during the period
- Cases Resolved: Number of cases successfully closed
- Cases Discarded: Number of cases discarded (manual or automatic)
- Avg Initial Response: Average time from case assignment to first agent message
- Avg Resolution Time: Average time from case assignment to resolution
Filtering Options:
- Search agents by name
- Filter by Projects and Queues
- Filter by status: All, Available, Busy, Away, Offline
Table Features:
- Sortable columns: Click headers to sort by any metric
- Customize KPIs: Click the "Customize" button (gear icon) to select which columns to display in the table
- Color coding: Status indicators use consistent colors (green=available, red=busy, yellow=away, grey=offline)
- Real-time updates: Data refreshes automatically (typically every 30-60 seconds)
- Pagination: If more than displayed limit (varies by screen size)
- Download button: Export current Agents tab view as CSV file for analysis and reporting
Role-Based Visibility:
- Managers/Admins: See all agents in their assigned projects with full metrics
- Agents: See only their own row with their personal performance data
2. Queues Tab
Provides real-time monitoring of agents and their current operational status.
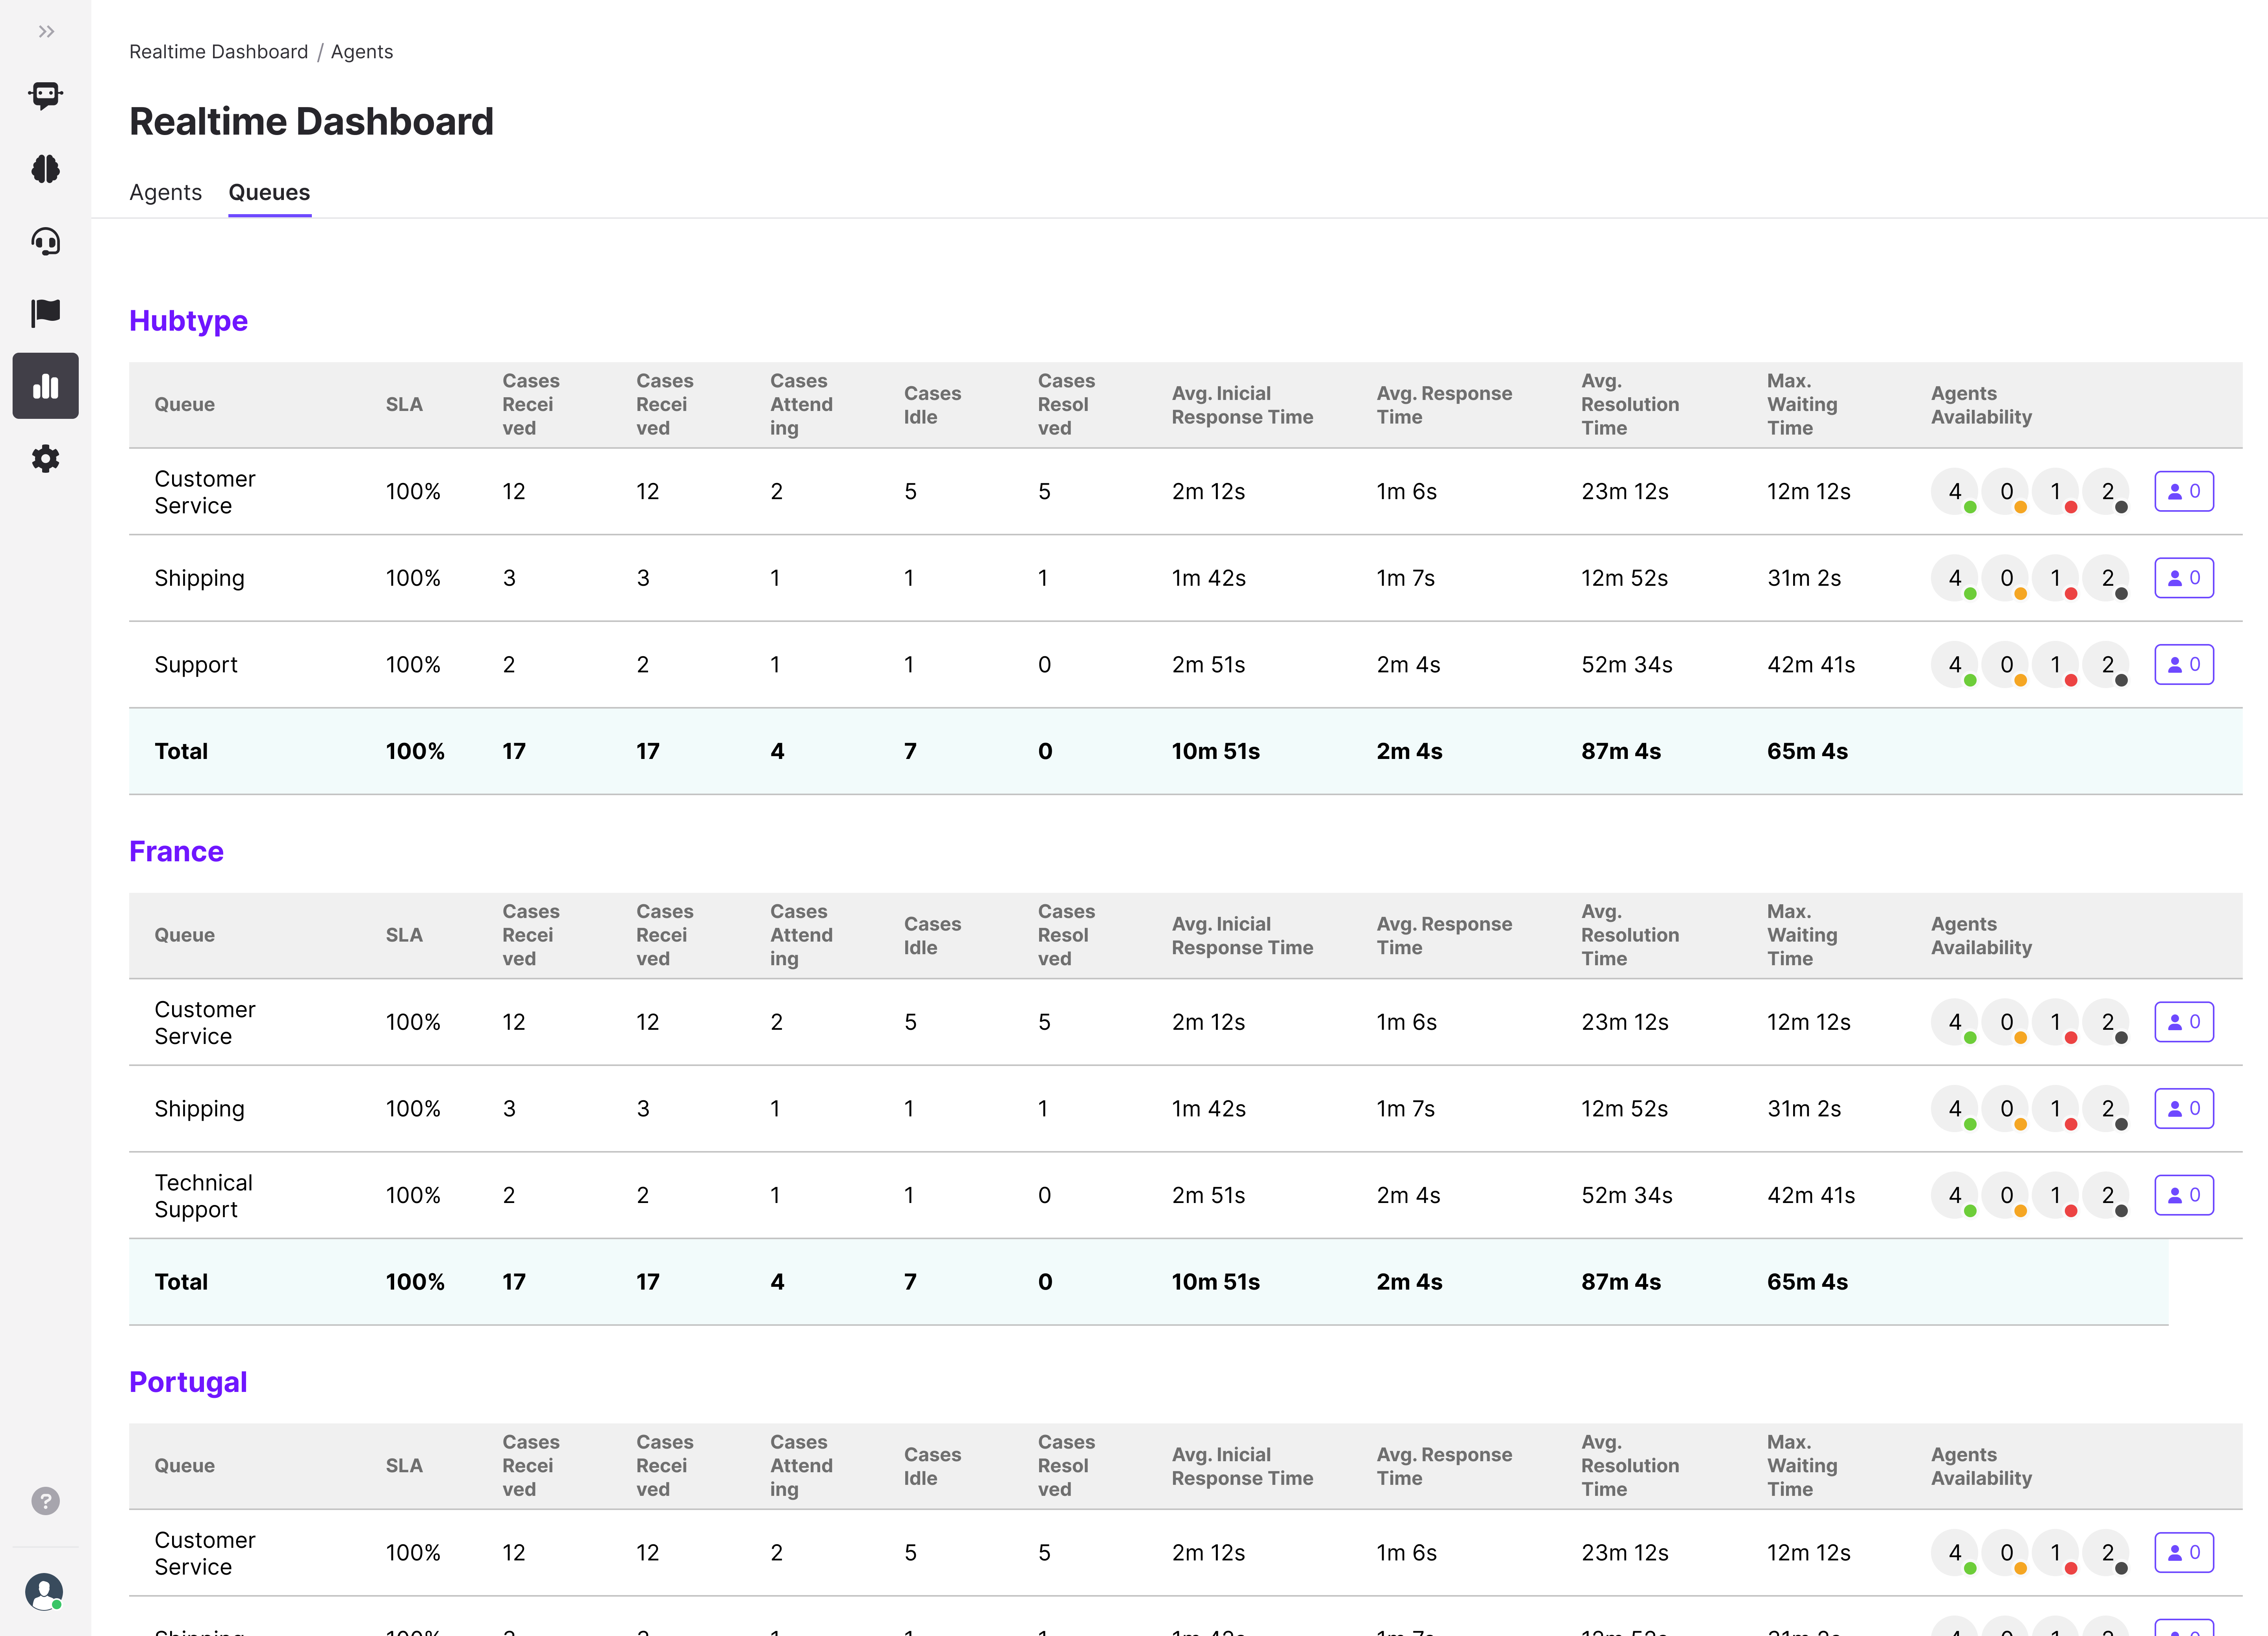
Queue-Level Metrics:
For each queue, managers can view:
- SLA %: Percentage of cases meeting SLA targets (attended before Red threshold)
- Cases Received: Total cases that entered the queue during monitoring period
- Cases Waiting: Current number of cases awaiting agent assignment
- Cases Attending: Cases currently being handled by agents
- Cases Idle: Cases marked as idle (awaiting customer response)
- Cases Resolved: Successfully closed cases during the period
- Avg. Initial Response Time: Average time from case arrival to first agent response
- Avg. Response Time: Average time between agent responses during conversation
- Avg. Resolution Time: Average time to close cases
- Max. Waiting Time: Longest current wait time for any case in the queue (critical indicator)
- Agents Availability: Visual breakdown showing number of agents in each status (Available/Busy/Away/Offline)
Queue Management:
- Each queue has a "Manage queue" button for quick access to agents configuration settings
- Queues are organized by project for easy navigation
Role-Based Visibility:
- Managers/Admins: See all agents in their assigned projects with full metrics
- Agents: Can only see information for their assigned queues.
Best Practices
For Managers
- Review the dashboard regularly throughout the day to identify trends
- Act quickly when multiple agents are Offline or Away during peak hours
- Monitor SLA % closely and redistribute agents when queues are struggling
- Use Max. Waiting Time as an early warning indicator for queue congestion
- Compare Avg. Initial Response Time against your orange SLA threshold
General
- Use the filter options to focus on specific projects or queues during issue investigation
- Combine Realtime Dashboard insights with Case Archive reports for complete visibility
- Address patterns (e.g., consistently high idle times) through training or process improvements